
2021 Edition
1. Presentation
This problem statement is framed into the Networks-track because it gives rise to develop ML models based on a training dataset that will be provided to participants.
[Video] Presentation of the scenario/model and introduction to the problem statement.
[PDF] Round table presentation to introduce the problem statement to participants.
1.1 Timeline
This is a summarized timeline of the challenge:
- Registration deadline (see section 1.2) - 21/10/2022 - Available now
- Publication of the training data set - 07/07/2022 - Available now
- Publication of the test data set - 08/2022
- Competition phase - 31/05/2022 - 28/10/2022
- Submission of solutions - 28/10/2022
- Grand challenge finale - December 2022
1.2 Registration
You can register before at https://challenge.aiforgood.itu.int/
The steps you need to follow are:
-
Participants should register at the official website
-
Choose the problem statement to work on [ML5G-PS-008].
-
Choose a team leader who will “create the team [e.g., FedSirs]” under the problem statement [ML5G-PS-008]
-
Admin will approve the team creation
-
Team members request to join the team [FedSirs]
-
A team leader should approve the request to join the team.
2. Background
2.1 Description of the scenario
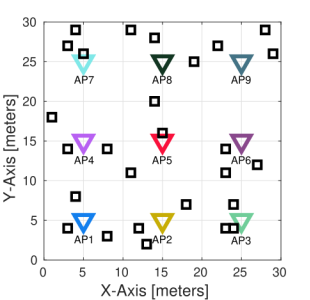
The figure below shows the scenario used for the simulations. It consists of M=9 access points (APs) and a variable number of stations (STAs), i.e., for each deployment the number of STAs associated to each AP is a random number, N = 1, 2, …, 5. All APs are located at the center of a subarea of 10x10 meters and STAs are placed uniformly at random in the corresponding subarea and associated to the nearest AP.
All APs are set to operate in the same channel, so they are overlaping. We consider only download traffic under saturation conditions, and APs are able to transmit simultaneously using coordinated spatial reuse (c-SR) scheme [1-4]. The next figure shows an example of the employed transmission model.
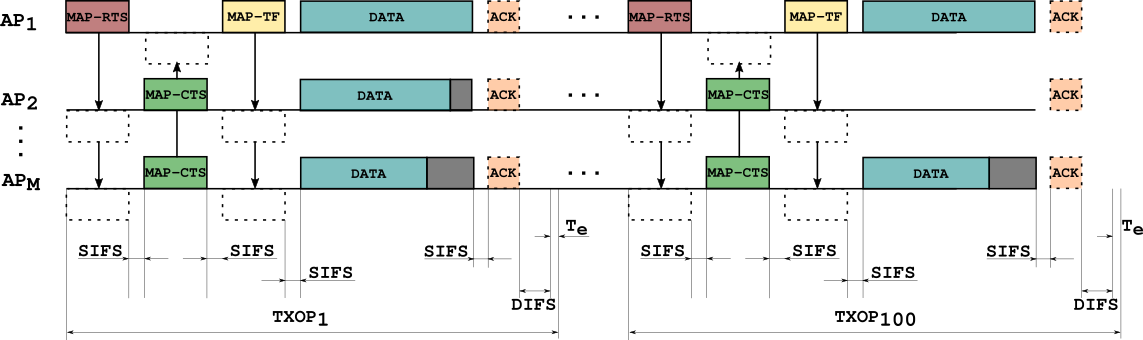
At every transmit opportunity (TXOP), the number of APs selected to cooperatively transmit is a random number between one and four, and also which APs and STAs are randomly selected. Thus, the power received at the stations, i.e., the received signal strength indicator (RSSI) is stored in a matrix for all the AP-STA links -RSSI matrix. As simultaneous transmissions are allowed, the quality of the received signal, i.e., the signal-to-interference-plus-noise ratio (SINR) at the receiver is influenced by the RSSI of the desired transmitter as well as the potential interferer. MAP-RTS and MAP-CTS are used to reserve the channel and MAP-TF is useful to exchange information between the coordinated APs.
3. Data set and Resources
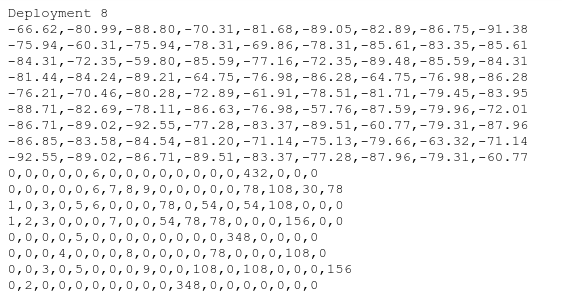
A dataset generated on Matlab is provided to train ML models. You can access the dataset at aiforgood site. It is intended for training a machine learning model that has to be able to estimate the throughput. The training dataset is split into several files (10000), each of them contains the information about one deployment. At every deployment, the number of stations as well as their positions are randomly generated. Once the scenario is generated, APs start transmitting and they are randomly selected for all TXOPs (100 TXOPs per deployment).
The training files include the information of each deployment as follows:
- Header line, indicating the number of the deployment, e.g., Deployment 1.
- The next rows contains the RSSI matrix. Values are in decibels (dB). The size of this matrix is NxM, where M is the number of APs (set always to 9) and N is the number of STAs randomly selected for this particular deployment.
- Then the information about each TXOP appears. In each row, the first 9 columns indicate the AP-STA pairs, e.g., 2,0,0,0,0,0,0,0,27 means AP1 (because the number 2 is on the first position which corresponds to AP1) transmits to STA2 and AP9 transmits to STA27. No other AP transmits, so its represented with zeros. Then the values of throughput (in Mbps) referred to this particular TXOP are given behind, e.g., 108,0,0,0,0,0,0,0,54 where 108 and 54 are the corresponding value AP1-STA2 and AP9-STA27, respectively, in the example above.
In some cases, when the value of SINR at the receiver is under certain threshold, the STA is unable to decode the received frame without errors, so the value of throughput is considered equal to zero. Thus, in the example above if STA27 were unable to decode the frame properly, its throughput would have been set to zero, and the entire row would be: 2,0,0,0,0,0,0,0,27,108,0,0,0,0,0,0,0,0. The figure below shows an excerpt of a deployment.
4. Submission guidelines
- Deliverable 1 (27 October 2022, 23.59h CEST time): In this deliverable, participants need to submit a .txt or .csv file with the throughput predictions done by their model. Using the first half of the test dataset (from Deployment 1 to Deployment 500), participants will be able to train a ML model that estimates the throughput for a given set of scenarios only with the information about the RSSI matrix and a subset of AP-STAs selected to transmit/receive at every TXOP.
-
Deliverable 2 (27 October 2022, 23.59h CEST time): Using the second half of the test dataset (from Deployment 501 to Deployment 1000) participants have to submit a .txt or .csv where they have to be able to estimate the combination around every AP that achieves the best aggregate throughput for every deployment, constraining the number of APs to at most 4 (they have to explicitly indicate the AP-STA pairs in each case).
- Deliverable 3 (November 2022): A written report explaining the proposed ML model, as well as the technical details regarding pre-processing, training, validation, etc.
Report structure:
- Introduction: Source code + documentation
- Methodology: method used and motivation, description of the proposed ML solution.
- Pre-processing & Training: how data has been prepared to feed the selected ML model, how training is done.
- Results
- Encountered issues
- Deliverable 4 (December 2022): A presentation in the grand challenge finale.
[2] López-Pérez, D., Garcia-Rodriguez, A., Galati-Giordano, L., Kasslin, M., & Doppler, K. (2019). IEEE 802.11 be extremely high throughput: The next generation of Wi-Fi technology beyond 802.11 ax. IEEE Communications Magazine, 57(9), 113-119.
[3] E. Khorov, I. Levitsky and I. F. Akyildiz, “Current Status and Directions of IEEE 802.11be, the Future Wi-Fi 7,” in IEEE Access, vol. 8, pp. 88664-88688, 2020, doi: 10.1109/ACCESS.2020.2993448.
[4] C. Deng et al., “IEEE 802.11be Wi-Fi 7: New Challenges and Opportunities,” in IEEE Communications Surveys & Tutorials, vol. 22, no. 4, pp. 2136-2166, Fourthquarter 2020, doi: 10.1109/COMST.2020.3012715.
6. Contact
David Nunez ([email protected])
Rashid Ali ([email protected])
Boris Bellalta ([email protected])