Field work: Intersectional Sampling
Between early 2024 and mid-2025, INTERMAPS’ team carried out extensive fieldwork across Catalonia using the Relief Maps+ tool. Working through trusted community, professional, and personal networks, we accessed a wide variety of social settings — from rural schools and civic centres to LGBTQ+ groups, disability organisations, and public institutions.
We collected data from 1,000 participants and the only inclusion criteria were:
- being 8 years of age or older
- residing in Catalonia at the time of participation.
This minimal inclusion threshold was intentionally defined to ensure that groups often excluded from research, particularly children and older adults, undocumented migrants, or individuals not formally registered, could be part of the sample.
Our sampling strategy combined intentional entry points (such as age or linguistic background) with the emergent diversity that arose through real-world contacts, resulting in internally heterogeneous groups. This iterative, reflexive approach allowed us to build what we call intersectional representativeness: a sample that captures the socially relevant intersections shaping inequality in the Catalan context.
Based on the avatar model, here we present our final sample, a visualization that goes beyond traditional charts or percentage breakdowns and that simplifies complex intersecting categories.
INTERMAPS sample

Image 1: Visual representation of the full sample (n = 1,000)
All data collection was conducted in person, in settings ranging from small group sessions to large collective exercises with up to 50 participants, and adapted to participants’ digital, cognitive, and linguistic needs, enabling the inclusion of children, older adults, undocumented migrants, people with disabilities, and many others often excluded from large-scale research.
Depending on participants' digital, cognitive, or linguistic abilities, we adapted our approach: fully autonomous use of the tool was possible with digitally literate groups (e.g., secondary or university students), while for others, such as children, elderly people, participants with disabilities, or those with limited literacy, researchers offered assisted participation, functioning almost as interviewers to ensure that each person’s input could be faithfully captured.
This method allowed us to adapt our practice to participants’ needs, rather than expecting them to adapt to a standardized research protocol. As a result, we were able to include participants across a broad range of positionalities and access conditions. Ethical and consent procedures were adapted accordingly. To ensure informed and voluntary participation, we developed a short explanatory video that was shown to participants before they engaged with the tool, enabling them to fully understand the purpose of the study and their role in it beyond the formal consent.
To capture the data collection process visually, we created two illustrative images one that offers a collection of 1000 apples to represent the diverse social positions occupied by each individual within the sample (Image 1) and a comprehensible representation of the sampling process to depict the various paths followed to reach participants (Image 2 and 3).
Our tree highlights not only the diversity of contact types and social groups reached, but also reflects the importance of the team, showing how the researchers' positions and networks shaped who was accessed, how, and through what kind of effort.
Each “branch” represents a distinct contact point, coloured by the nature of the relationship (family, friendship, work, activism), and indicates the size, accessibility, and group characteristics of each data collection site.
The figure also distinguishes between successful and unsuccessful attempts to access participants, showing failures in recruitment processes, as well as reasons for non-participation, and levels of recruitment effort (for the full legend, see Image 3).
In sum, it reflects the logic shared by the entire team: a decentralized, networked, and flexible model of access, informed by critical epistemologies and grounded in local knowledge and relationships.
Visualising Intersectional Sampling
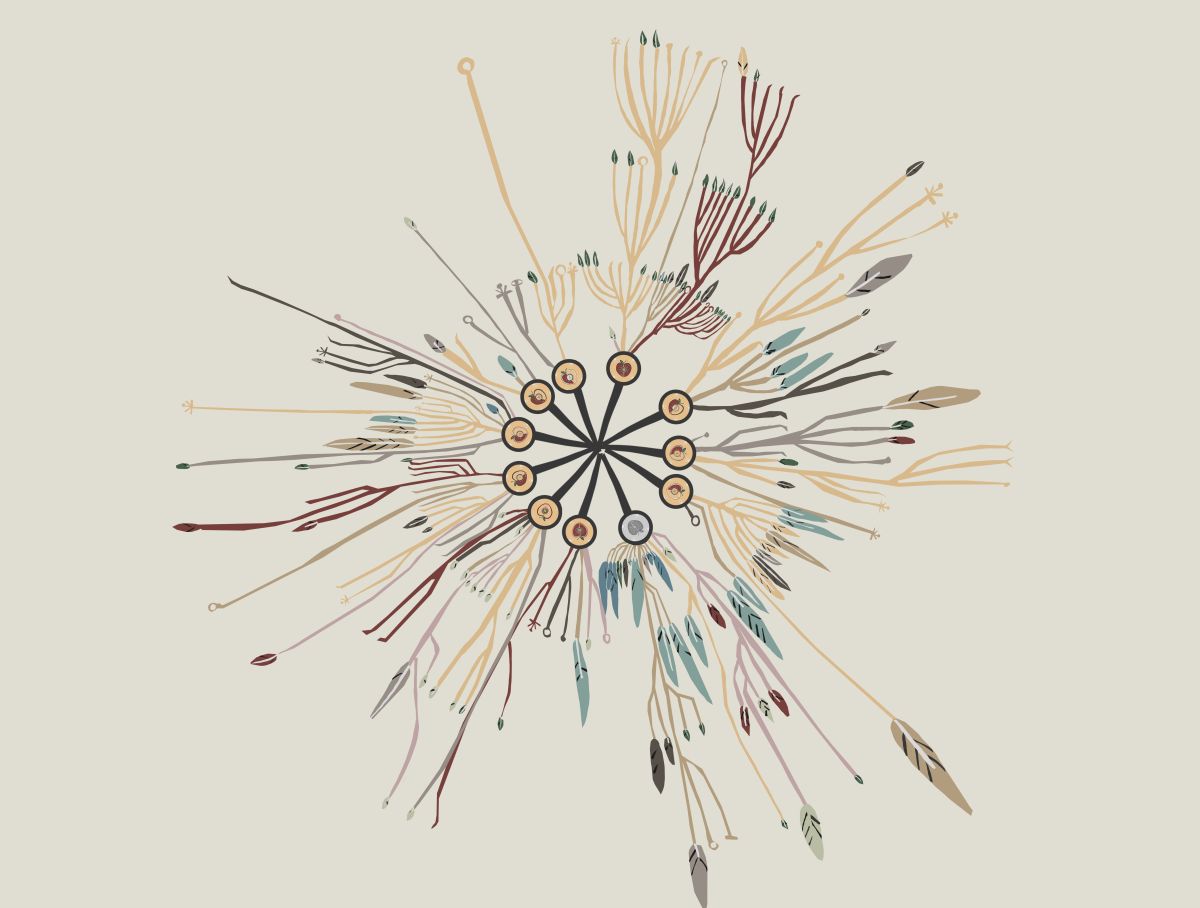
Image 2: Visual representation of the full sampling process across the research team
Legend for interpreting the sampling diagram

Image 3: Legend of the visual representation of the full sampling process across the research team