An app allows viewing the daily evolution of Covid-19 around the world
The website, created by David Rossell, a Ramon y Cajal fellow at the Department of Economics and Business at UPF, extracts information from two powerful databases linked to Johns Hopkins University and the European Centre for Disease Prevention and Control. As the researcher explains, the evolution of the data shows that the disease is not spreading exponentially, the number of people who have recovered from the disease is increasing, and the growth rate is tending downwards.

David Rossell, a Ramon y Cajal researcher in Mathematics, linked to the Department of Economics and Business at UPF and to the Barcelona GSE Data Science Center, has created an application that provides statistics, charts and raw data on the development of Covid-19 around the world, updated daily. By analysing data and the progress of the disease in different countries, the researcher concludes that growth is slowing down (not increasing exponentially) and that the number of people who have recovered from the disease is also increasing.
According to its creator, the application aims to help easily and visually to follow the evolution of the disease, in particular, to appreciate similarities and differences between countries. “I also seek through this tool, to reassure people a little because we hear a lot of bad news, but it must be said that there is also some positive”, he asserts. Another reason outlined by David Rossell is “to motivate students and make them see that statistics and data science are highly useful, fun disciplines”.
The application obtains updated data from two sources, chosen by the user: on the one hand, the database of the European Centre for Disease Prevention and Control (ECDC), and the other the one provided by the Johns Hopkins Center for Science and Systems Engineering (USA) via the Github platform, the largest repository of open software and source of open data in the world. “The two databases have some differences. One important one is that Johns Hopkins gives the number of people recovered, while the ECDC only offers total cases (whether active or not) and deaths”, David Rossell affirms.
Non-exponential increase and slowdown in disease growth
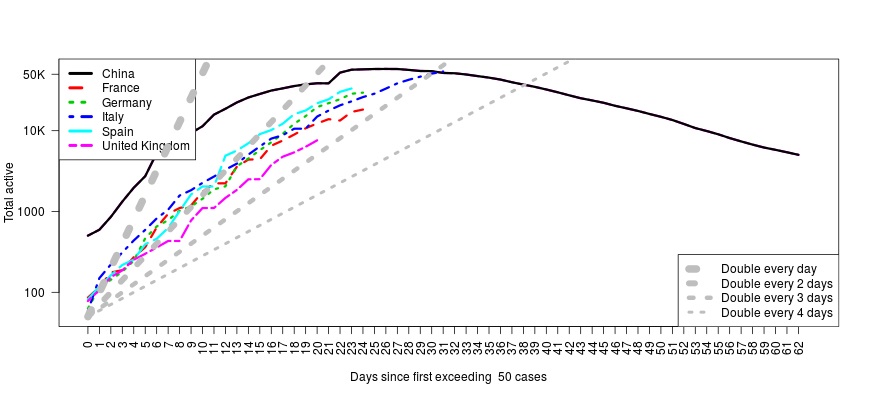
The app created by David Rossell includes several charts, referring to the total number of confirmed and active cases, with a comparison of the dynamics of the spread of Covid-19 between countries; the number of new infections and the daily infection rate; the number of cases and the percentage of recovered; the number and percentage of deaths; and raw data on cases confirmed, recoveries and deaths, among others.
A special section refers to the how quickly the disease is growing, which, according to the researcher, is not exponential since in order to be so, “every day the number of cases would increase by a fixed, constant percentage, and this is not the case”. David Rossell explains:“Suppose today we have 100 cases and tomorrow 200, that is to say, double. Then in two days we would have 2x200 (400 cases), in 3 days 4x200 (800 cases), etc. At this rate, it would increase very fast, in just ten days we would have 204,800 people infected”.
David Rossell states that the data show a widespread slowdown in the growth of the infection: “What we are seeing in most countries is that the percentage growth is tending to slow down. In Spain and Italy it can be clearly seen since the start of confinement, if we look at the chart of daily percentage of infections, they have fallen from 40% to 20% in seven days”. Thus, if at the beginning of the pandemic each person infected by Covid-19 infected two people every day, now the number is far lower: about 0.2 people in Spain, like in other European countries”.

More recovered, differences between countries and an unreliable mortality rate
According to David Rossell, another consideration made evident through data analysis is that the measures being taken are having an effect: “Right now it is inevitable that the number of cases will increase every day, but the number of cases of people who have recovered is on the rise and the rate of growth has a downward trend”, he assures.
However, the data show that the recovery process is slow: “In China 40 days ago they reached the peak of active cases, and although they practically have no new cases, the rate of recovery is slow, that is, it seems that they will still take some time to reach zero active cases. It is dangerous to extrapolate this to other countries, but given the similar evolution, it would not be surprising for Europe to take a similar length of time, considering that we have not yet reached the peak”.
“It is currently not possible to make reliable comparisons of the death rate”.
Differences between countries are also detected. “On the one hand, South Korea and Japan were able to mitigate the disease very quickly. As for the most European countries, they have similarities in the evolution of the rate of growth of the number of cases, while the main difference is in the number of cases detected”, he assures.
David Rossell argues that it is currently not possible to make reliable comparisons of the death rate. “Germany apparently has a lower death rate, but this is partly because many more people have been tested. In fact they did the same in Korea. Spain is one of the countries to have conducted the fewest tests in relation to the number of cases we have had”.
The researcher warns that these data collected have their limitations as people who suffered the disease but in who went undetected should be taken into account, as well as the varying precision and reliability of reports from country to country.
